Welcome to the engine room. This first post is a living style guide — every infographic block this blog can draw, rendered with real markup. Open it in the CMS editor to see the source side by side with the result, steal freely, then delete it or keep it as your cheatsheet.
Stat cards
The bread and butter of data-backed writing — lead with the numbers:
The big number
When one figure is the story, let it shout:
Bar chart
Horizontal bars, auto-scaled to the largest value. Add a third column to pick a colour per bar:
Line chart
Server-rendered SVG — no chart library, no tracking, loads instantly:
Donut chart
Shares of a whole, with an automatic legend:
Progress bars
Anything measured against 100%:
Timeline
For history and roadmaps:
Comparison
Before/after, this/that, us/them:
Pull quote
Without data you're just another person with an opinion.
W. Edwards DemingCallouts
Boxed notes in any accent colour — markdown works inside:
Method note — every chart on this page is rendered server-side as SVG or plain HTML. View source: there is no JavaScript chart library to download.
Caveat — demo numbers above are illustrative. Real posts cite real sources.
And ordinary markdown, of course
Regular paragraphs work as expected, with bold, italics, highlights, corrections, inline code and links.
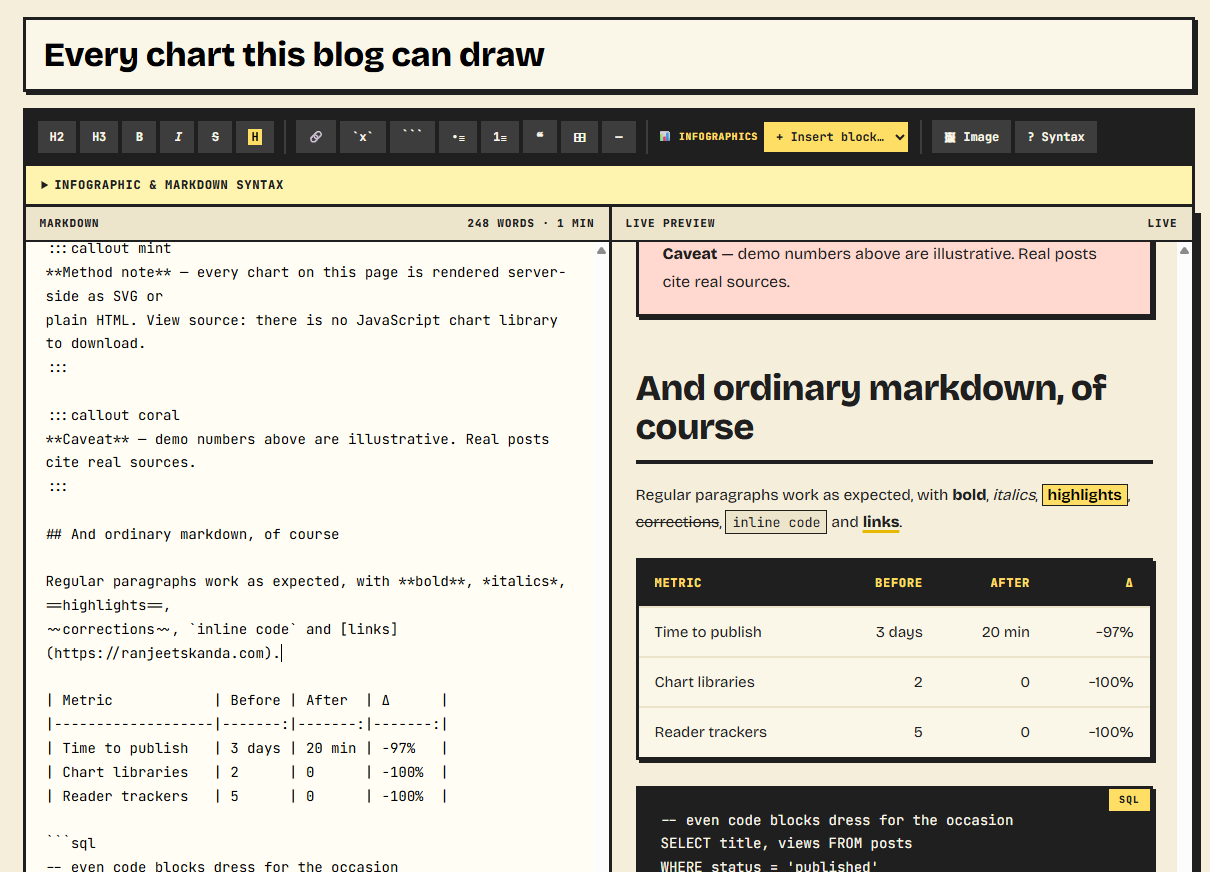
| Metric | Before | After | Δ |
|---|---|---|---|
| Time to publish | 3 days | 20 min | −97% |
| Chart libraries | 2 | 0 | −100% |
| Reader trackers | 5 | 0 | −100% |
-- even code blocks dress for the occasion
SELECT title, views FROM posts
WHERE status = 'published'
ORDER BY views DESC LIMIT 5;
One blockquote for the road: write the number first, the adjective second — if at all.
That's the whole toolkit. Now go write something with receipts.